

Where to find the 2027 grade thresholds
As of 13 November 2026, Cambridge has yet to publish thresholds for its 2027 IGCSE exam series. Cambridge sets thresholds after the papers have been sat and marked. When your table is available, go to the official Cambridge IGCSE grade threshold archive and open the exam series you sat. Then select the PDF for your four-digit syllabus code.
Cambridge names its tables by the series in which you sat the papers. If you sat in February/March, look for the March series. If you sat in May/June, look for June. If you sat in October/November, look for November. For example, if you sat papers in November 2026 and get your results in January 2027, the matching table is November 2026. Cambridge lists the release dates separately on its results page and its March series page for India and Romania.
What is a Cambridge IGCSE grade threshold?
A grade threshold is the minimum mark required for a grade. Cambridge publishes both component thresholds, which apply to individual papers and use raw marks, and syllabus thresholds, which apply to the overall qualification and use marks after component weighting. A candidate earns the highest overall grade whose threshold they reach on their own combination row.
If two versions of a paper are slightly different in difficulty, their thresholds can differ. Cambridge uses a range of evidence, including exam performance and expert judgement, to maintain comparable standards. Each threshold is specific to its paper or combination and exam series. Cambridge also distinguishes the overall A* grade from individual paper grades. How Cambridge marks and grades exams.
How to read an official Cambridge threshold table
- Match the series. Start with the month label and year printed at the top of the PDF. Use the series on your exam entry or timetable.
- Match the syllabus code. For example, Cambridge Maths 0580 and Cambridge Maths (9–1) 0980 have different codes and tables. The subject name alone may be ambiguous.
- List all components you sat. Copy the exact codes from your entry or ask your exams officer. Keep the final digit of each code. For instance, 0625/42 identifies Physics component 42, and 0625/62 identifies component 62.
- Find the syllabus row with that combination. Start with the complete set of components and look across to the grade columns. If there is an option code, use your own entry details to confirm the match.
- Compare in the right units. The component table uses raw marks out of that paper’s maximum. The syllabus table uses a weighted total. If the centre has provided your component marks, use the weighting factors for the syllabus before comparing your overall total with the syllabus row.
If the row shows a dash under a grade, Cambridge has no threshold for that grade on that row. For example, the June 2026 Core combinations in Mathematics 0580 show grade C as the highest available grade. The raw maximum and the weighted maximum are also worth reading separately, even when they happen to be equal.
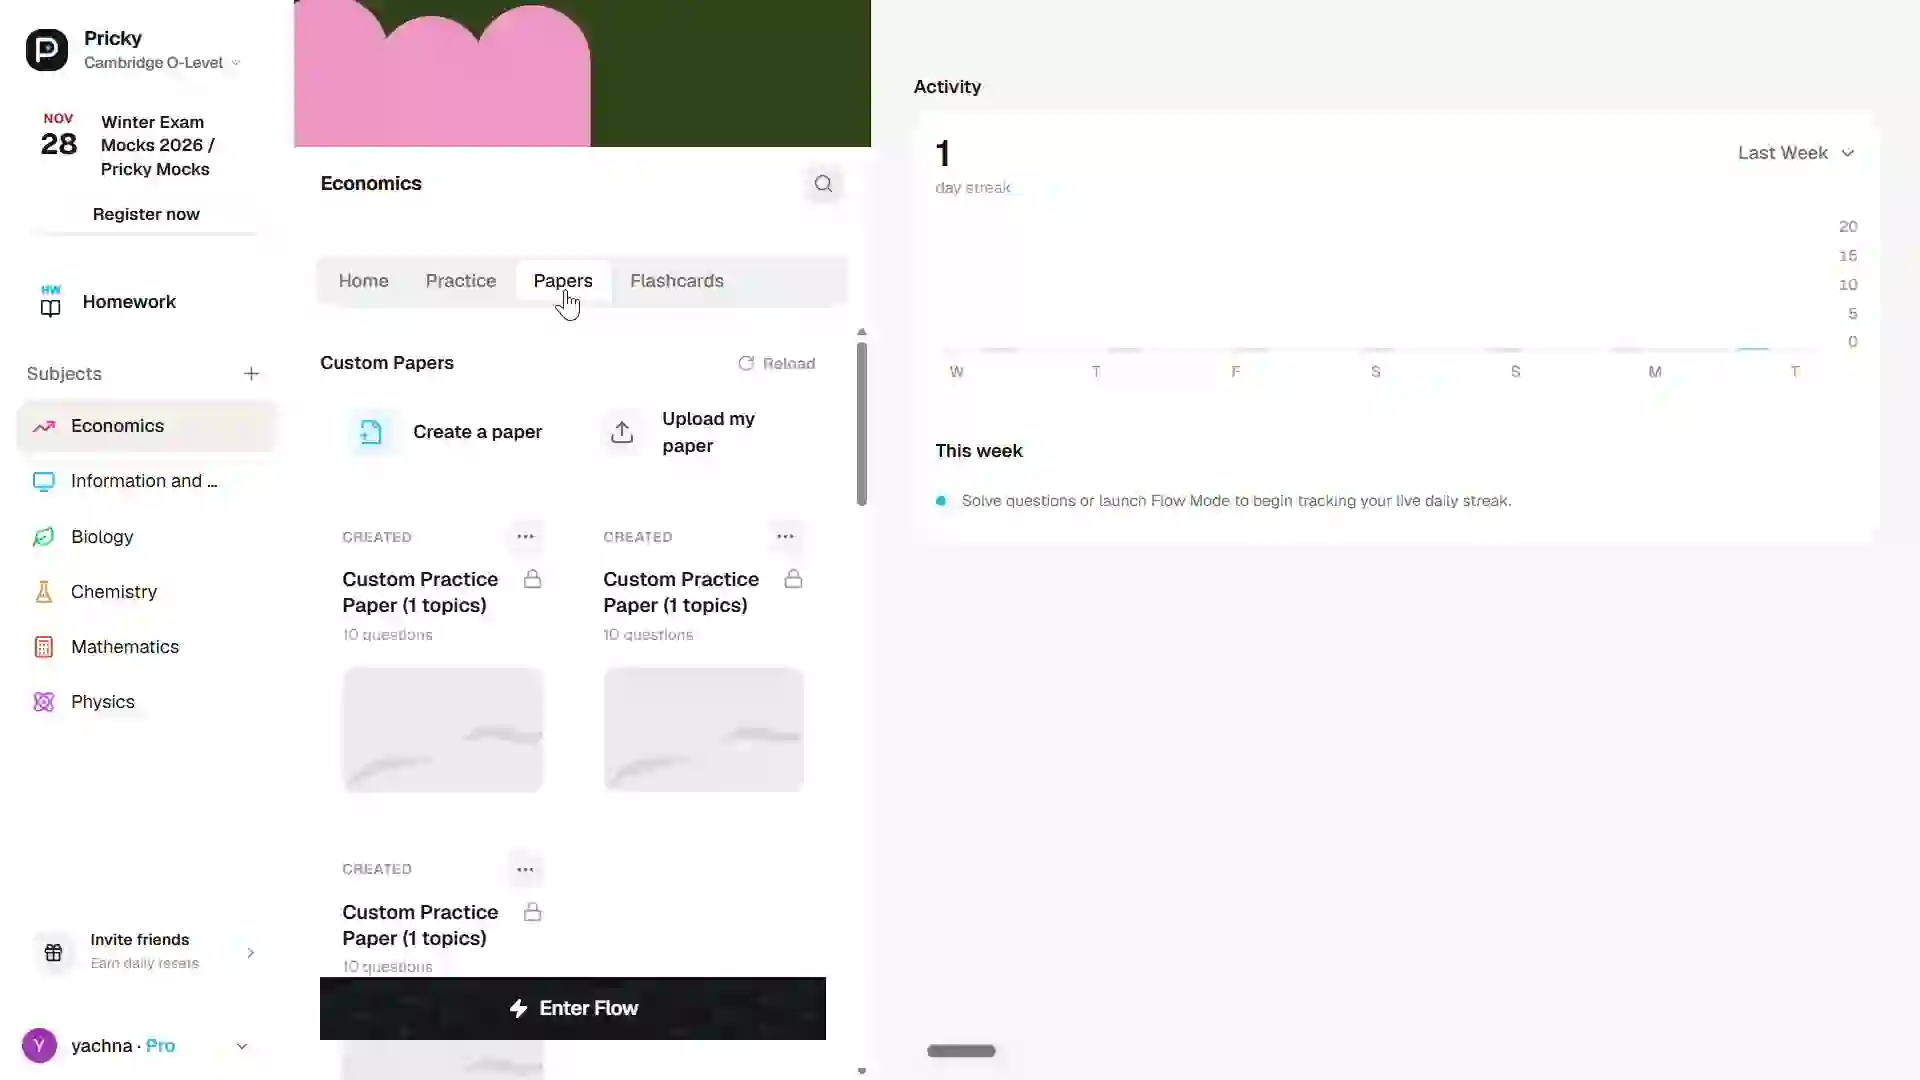
Build a practice paper in PrickyAI
Choose questions for a practice session and work through the paper in the app.
Worked example: June 2026 Maths 0580
In the June 2026 Cambridge IGCSE Mathematics 0580 table, a candidate who sat the Extended components 22 and 42 would use the row with those two codes and a maximum weighted mark of 200. The historical cutoffs below are from the second page of the Cambridge June 2026 Mathematics 0580 threshold PDF.
| June 2026 component combination | Maximum weighted mark | A* | A | B | C |
|---|---|---|---|---|---|
| 22 and 42 | 200 | 177 | 154 | 120 | 87 |
| 21 and 41 | 200 | 162 | 138 | 114 | 90 |
A candidate on components 22 and 42 with a weighted score of 156 out of 200 would earn an A in this historical example. They reach 154 and fall below 177. A score of 156 would also earn an A on the 21-and-41 row, but the distance to the A* boundary would be 6 marks on that row and 21 on the 22-and-42 row. If the example score were 165, the two rows would give different grades.
On page one, the A cutoff for component 22 is 75 out of 100. A score of 75 on that paper tells you where the candidate sits relative to the single-paper A threshold. Their final qualification grade still depends on the overall mark. For revision under the current 0580 structure, practise the Extended non-calculator paper and the calculator paper separately, then review where each lost mark came from. The PrickyAI Paper 2 guide includes worked non-calculator practice. Cambridge Mathematics 0580 syllabus.
Worked example: June 2026 Physics 0625 weighting
In the June 2026 Physics 0625 table, components 22, 42 and 62 have raw maxima of 40, 80 and 40. The Extended multiple-choice, Extended theory and Alternative to Practical papers count for 30%, 50% and 20% respectively. On the published 200-mark scale, that makes the weighted maxima 60, 100 and 40, corresponding to multipliers of 1.5, 1.25 and 1. Cambridge Physics 0625 syllabus.
Suppose a candidate’s raw marks are 28, 52 and 29. The raw sum is 109 out of 160. Their weighted mark is 42 + 65 + 29 = 136 out of 200. The published A and A* thresholds for this historical row were 134 and 161, so that example would reach an A. Converting 109 out of 160 directly to a 200-mark scale would give 136.25 for this particular set of scores, but it is a different calculation. For example, raw marks of 20, 50 and 39 also add to 109 and would produce a weighted total of 131.5 before rounding, below that same A threshold. Cambridge June 2026 Physics 0625 threshold PDF.
For each subject, follow the component-weighting link on Cambridge’s grade threshold archive and use the factors listed for your syllabus and series. The same raw mark can contribute a different amount to the overall grade depending on the paper and how Cambridge weights it.
What does the percentage on a results statement mean?
In regions where Cambridge reports a Percentage Uniform Mark (PUM) for this grading scale, the PUM is an additional number shown alongside the grade. A PUM of 90 is the lower end of the A* band. A candidate can receive a PUM of 90 after reaching an A* threshold below 90% of the available exam marks. For example, the June 2026 Maths 0580 threshold of 177 out of 200 equals 88.5% of the weighted marks, yet meets the A* standard for the 22-and-42 combination in that series. Compare component or weighted marks to the threshold table and read PUM from the results statement as its own measure. Cambridge guide to percentage uniform marks.
Why does the weighted maximum vary by subject?
Cambridge publishes the factors for each syllabus and assessment structure. Physics 0625 uses three components in the worked example above. Economics 0455 uses two, with different raw maxima and weighting factors. For assessment from 2027, Cambridge states that Economics Paper 1 stays out of 40 and Paper 2's 80 raw marks are scaled to 95. The maximum weighted mark is 135, compared with 120 when the raw maxima are added. Cambridge Economics 0455 weighting from 2027
Suppose you score 30 out of 40 and 56 out of 80 on a practice set in the revised format. Your raw total is 86 out of 120. Applying the published factors gives 30 + (56 × 1.1875) = 96.5 out of 135 before any final rounding. This is an example of the calculation only. A grade requires a published threshold for the same series and component combination.
| Number on your record | What it represents | What to compare it with |
|---|---|---|
| Raw component mark | Marks awarded on one paper | The component table for the same paper and series |
| Weighted total | Sum after applying the syllabus factors | The syllabus threshold row for the full combination |
| Percentage Uniform Mark | A score reported alongside the grade in some countries | The PUM scale in Cambridge's guidance |
| Score from a topical set | Performance on selected practice questions | A second set testing the same skills |
If you only have the qualification grade or PUM, ask your centre whether it can share your component marks. The raw marks let you locate where you gained or lost credit. Two students with the same grade can have very different strengths across their papers. Cambridge statements of results and component marks guidance
How to use past thresholds while revising for 2027
Mark each timed past paper against its own published mark scheme. Keep the raw marks by component and look up the official row for that exact practice series. Historical thresholds are useful for interpreting a complete mock, especially when all its papers came from the same set. A mock made from several series can still help you find weak topics, but it has no single official threshold row. When comparing progress, write down the series and component codes beside each weighted total so you can reproduce the comparison later.
Keep a short error log next to your scores. Record the question, where you lost marks, and one action for the next paper. For Maths, separate arithmetic errors from missing working. For Physics, separate practical skills such as graphs and experiment planning from explanations in the theory paper. The PrickyAI Paper 6 guide has practice for those skills. Comparing recurring errors across several timed papers helps you decide what to practise next.
If you are preparing for the March series, use the PrickyAI 2027 revision playbook to plan your timed mocks. When you get your official results, start with the grade on your statement. Ask your school or centre for the component marks and entry details if you want to understand how the grade was calculated.
Use PrickyAI to identify which marks to work on next
In PrickyAI, choose a short set that targets the component or skill where you keep losing marks. For a Physics mock, separate difficulties with theory calculations from difficulties reading scales and plotting points. Review those in different sessions, then sit another full paper and record the marks by component. When you calculate a weighted mock score, keep its source papers and series alongside the result.
If you built the mock from questions across multiple series, use the results to check your progress by skill. For example, track whether you now include units on graph gradients and whether you can explain an anomaly from the data. Use a full matching set of papers if you want to compare with a historical threshold. How to match Cambridge component codes and mark schemes